
A high-pressure heat dome drove temperatures to all-time records at sites in Montana, Utah and Wyoming on July 12, according to NASA Earth Observatory’s analysis of observations and weather-model output.
NASA’s map represents air temperature two meters, or about 6.5 feet, above the ground at 2 p.m. Mountain Time. It combines satellite observations with a version of the Goddard Earth Observing System numerical model rather than placing a thermometer at every mapped point.
The darkest areas approached or exceeded 45 degrees Celsius, or 113 degrees Fahrenheit. The broad ridge of high pressure covered much of the West and kept hot air in place while suppressing cloud formation and precipitation.
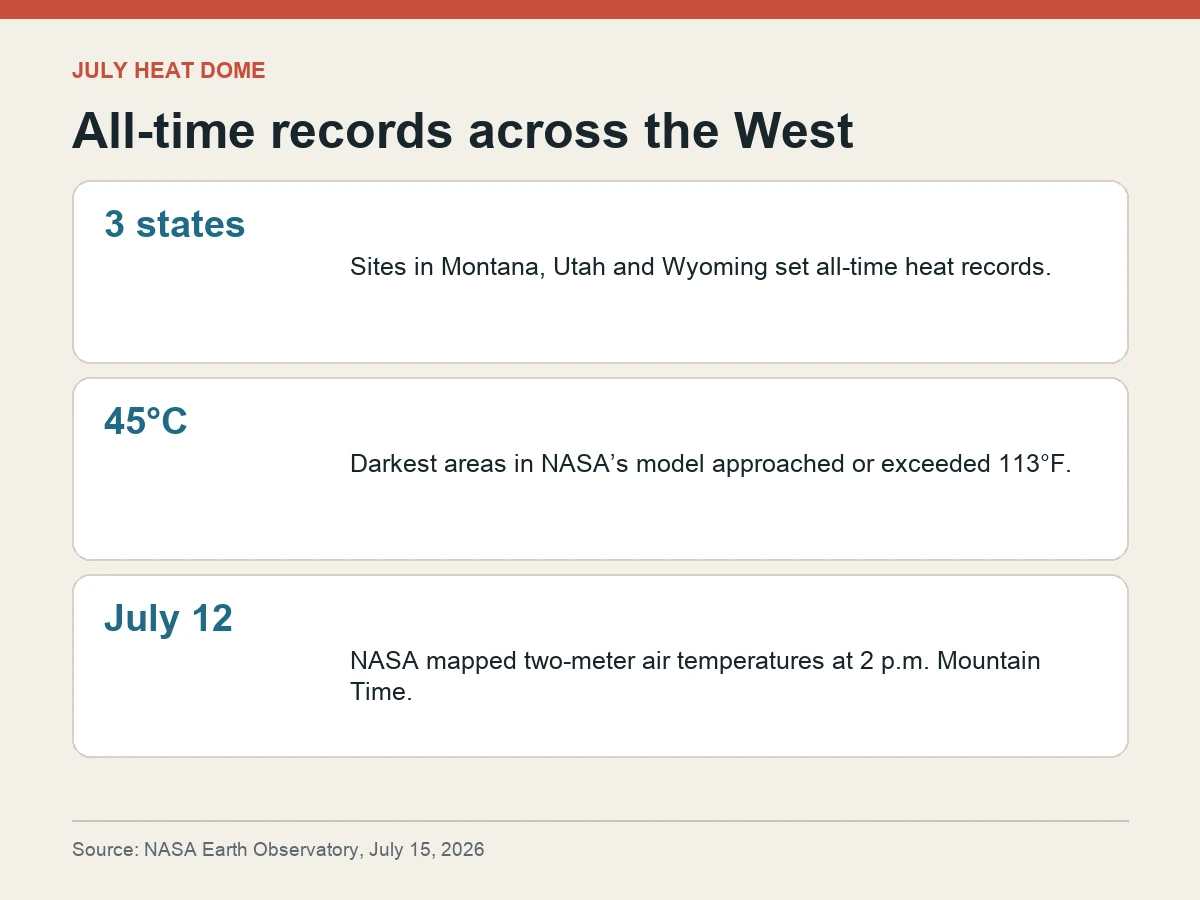
At airports in Billings and Miles City, Montana, temperatures reached 111°F and 115°F. Sheridan, Wyoming, reached 109°F. Each station exceeded its previous all-time record by at least two degrees; Miles City broke its prior mark by four degrees.
Those records have long baselines. NASA says the Montana station records extend to the 1930s, while the Sheridan series begins in 1907.
Multiple Utah locations also set all-time records. Deseret reached 115°F, placing it among the hottest labeled sites in NASA’s map.
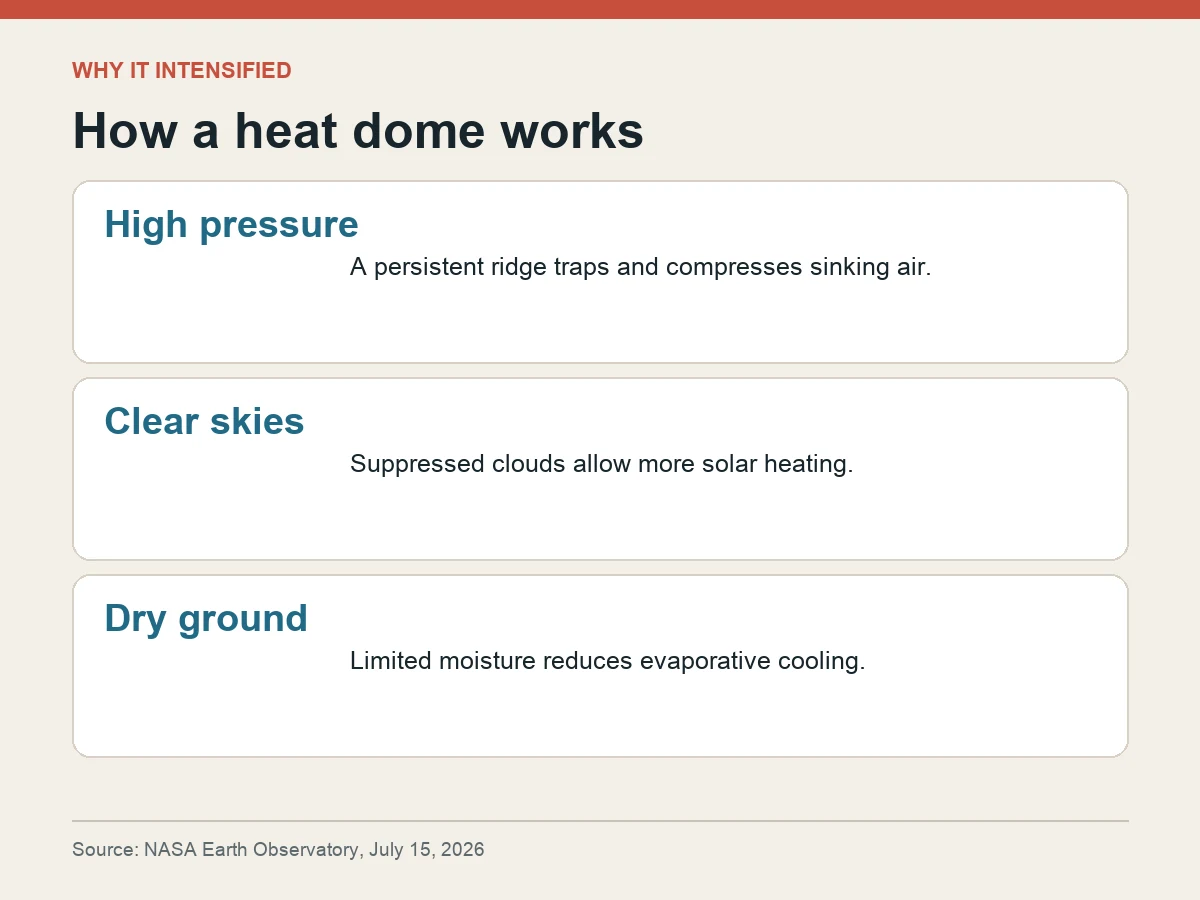
A heat dome forms when a persistent ridge of high pressure promotes sinking air. Compression warms that air, while reduced cloud cover lets more solar energy reach the surface. Dry ground can further limit the evaporative cooling that would otherwise moderate temperature.
The mapped values and station records answer different questions. The GEOS analysis shows the event’s regional structure; airport instruments establish precise local records. Neither alone attributes the event to long-term climate change, which would require a separate attribution study.
The event was part of a wider period of Northern Hemisphere heat. NASA noted concurrent heat waves in parts of Europe and Central and East Asia, but the Western U.S. records in this report are tied specifically to the July 12 ridge.