U.S. construction spending barely moved in June, but the flat headline concealed a much weaker picture than a year earlier and sharply different paths across building sectors.
The Census Bureau estimated work put in place at a seasonally adjusted annual rate of $2.1665 trillion, down 0.1% from a revised May rate of $2.1685 trillion. The agency’s sampling range around that monthly change includes zero, meaning the data do not establish that underlying spending actually fell rather than held steady.
Compared with June 2025, the estimate was 3.2% lower. During the first half of 2026, the value of construction put in place totaled an estimated $1.0469 trillion, 3.5% below the same six months a year earlier.
Private work still accounts for about three-quarters of the total
Private construction ran at a $1.6225 trillion annual pace, down 0.1% from May. Public construction was estimated at $544.1 billion and described by Census as virtually unchanged from the prior month.
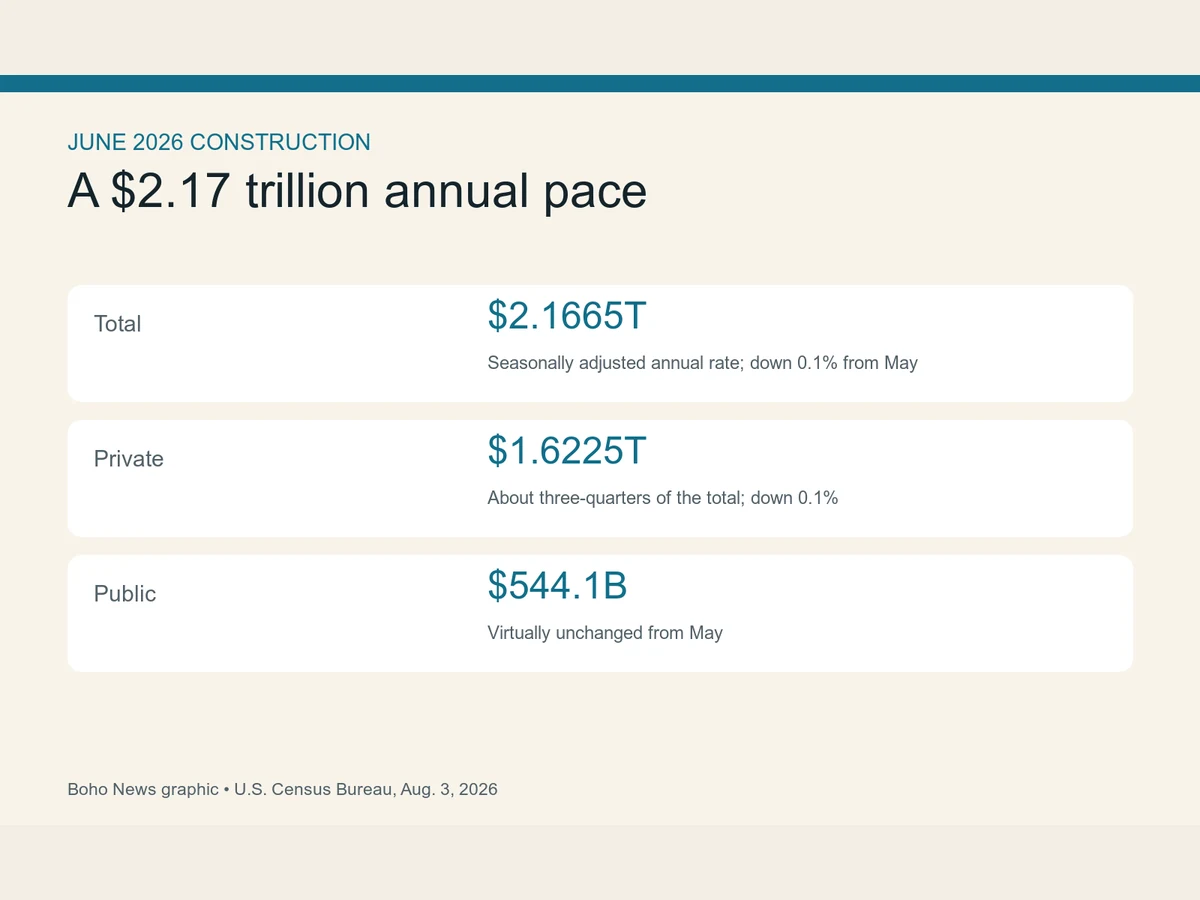
Those figures are annualized rates: they describe what spending would look like over a year if June’s seasonally adjusted pace continued. They are not the dollars actually paid during the month. Census also reports the values in current dollars, so changes can reflect both the amount of work and changes in prices.
Residential construction was estimated at an $889.4 billion annual rate, 0.3% below May and 4.7% below June 2025. Private residential work—by far the larger piece—was down 4.7% from a year earlier.
Manufacturing and office construction moved in opposite directions
The broad nonresidential estimate was only 2.1% below a year earlier, but its components were far from uniform. Manufacturing construction was estimated at $172.7 billion, down 21.4% from June 2025. Private manufacturing accounted for almost all of that category and was down 22.0%.
Office construction moved the other way. The annualized estimate reached $132.8 billion, 12.5% above June 2025. Private office work was up 15.1%, while public office construction was lower than a year earlier.
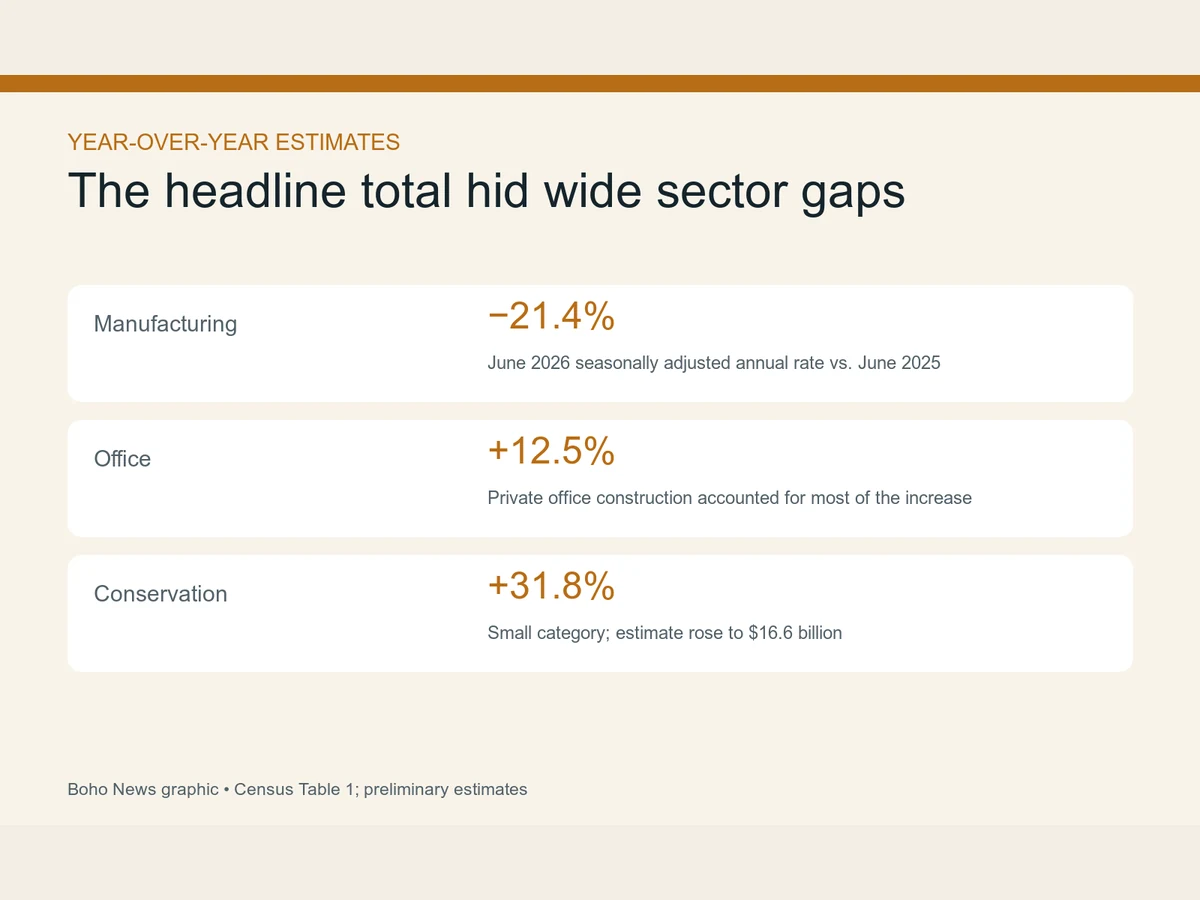
Conservation and development recorded the largest percentage increase among the listed broad categories, up 31.8% from a year earlier to a $16.6 billion annual rate. It is a much smaller category than highways, power or manufacturing, so a large percentage change has a limited effect on the national total.
Public highway and street construction, the largest public category, was estimated at $150.9 billion. That was 0.1% below May but 3.1% above June 2025. Public transportation construction was 3.8% higher than a year earlier.
Why one month is not a trend
The Census Bureau cautions that monthly estimates can be irregular. It says two months may be needed to establish an underlying trend for total construction and as many as eight months for individual categories.
June is also preliminary. The average absolute change between the preliminary estimate and first revision is 0.65% for total construction, 0.75% for private construction and 0.59% for public construction—larger than the reported one-month movement in the headline total.
The durable signal in this release is therefore not a statistically clear 0.1% monthly drop. It is the broader year-over-year decline and the widening gap between categories: manufacturing building substantially lower, office work higher and public infrastructure mostly stable to modestly above last year.