
The number of students with disabilities spending at least 40% of their school day in general-education classrooms increased 25% nationally from 2012–13 through 2023–24, the Government Accountability Office found.
That growth outpaced the 21% increase in the total number of students with disabilities over the same period. The largest increase came among students spending at least 80% of their day in general classes.
Federal law requires students with disabilities to be educated alongside peers without disabilities to the maximum extent appropriate. That “least restrictive environment” standard is an individualized decision, not a national quota for classroom placement.
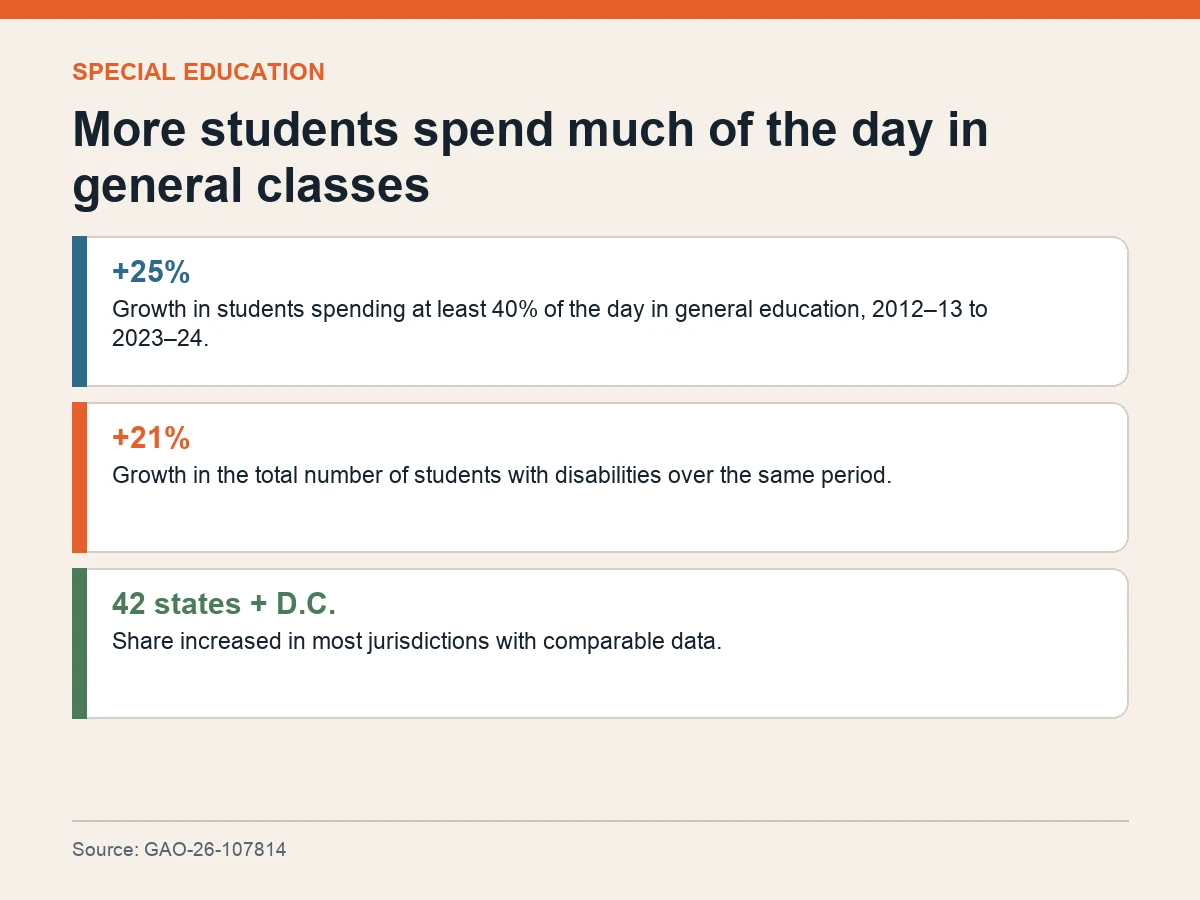
National movement toward general classrooms was widespread but not uniform. The share of students with disabilities spending at least 40% of the day there increased in 42 states and the District of Columbia. New Mexico lacked comparable 2023–24 data.
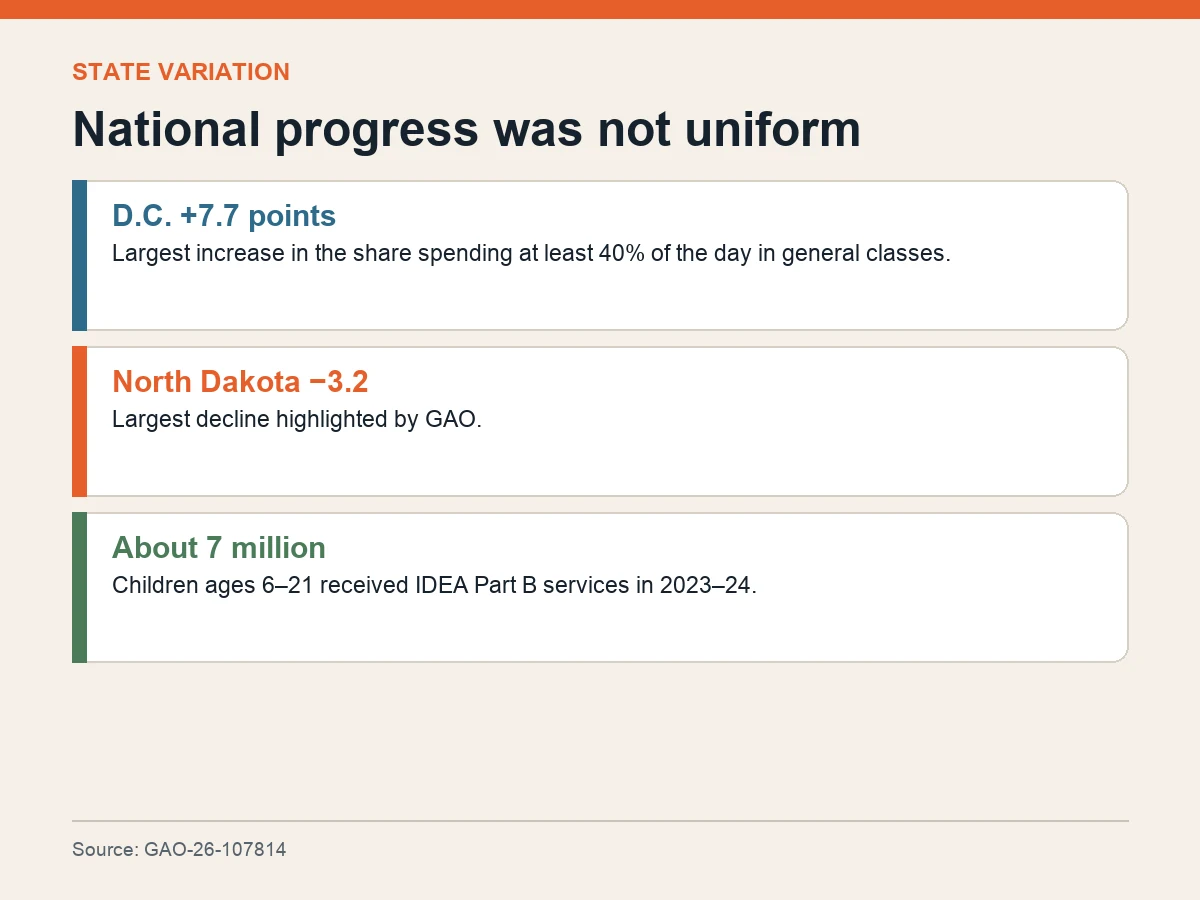
The District of Columbia recorded the largest increase, 7.7 percentage points. North Dakota moved in the opposite direction, with a 3.2-point decline. Within-state differences among districts were also substantial.
GAO found several district characteristics associated with higher placement rates in 2022–23, including not operating a standalone special-education school and having lower per-pupil revenue. Those statistical associations do not establish that one characteristic caused another.
Officials across 12 districts and eight schools in Connecticut, Illinois and Washington described resources, family participation and school culture as factors in placement decisions. Staffing, facilities and the capacity to adapt instruction can affect whether students are supported effectively in a shared classroom.
Belonging required more than a seat in the room. School officials described practices such as adjusting schedules so students could attend classes aligned with individualized goals, modifying curriculum, intentionally mixing student groups and creating inclusive extracurricular activities.
The report’s outcome measures need care. Placement data show where students spend time; they do not prove the quality of teaching, whether services in an individualized education program were delivered or whether a particular student learned more. GAO’s small opt-in questionnaire was not nationally generalizable.
About 7 million children ages 6 through 21 received special education and related services under Part B of the Individuals with Disabilities Education Act in 2023–24. The next policy question is not simply whether placement rates keep rising, but whether schools have enough trained staff, accessible programs and usable evidence to make inclusion effective for each student.