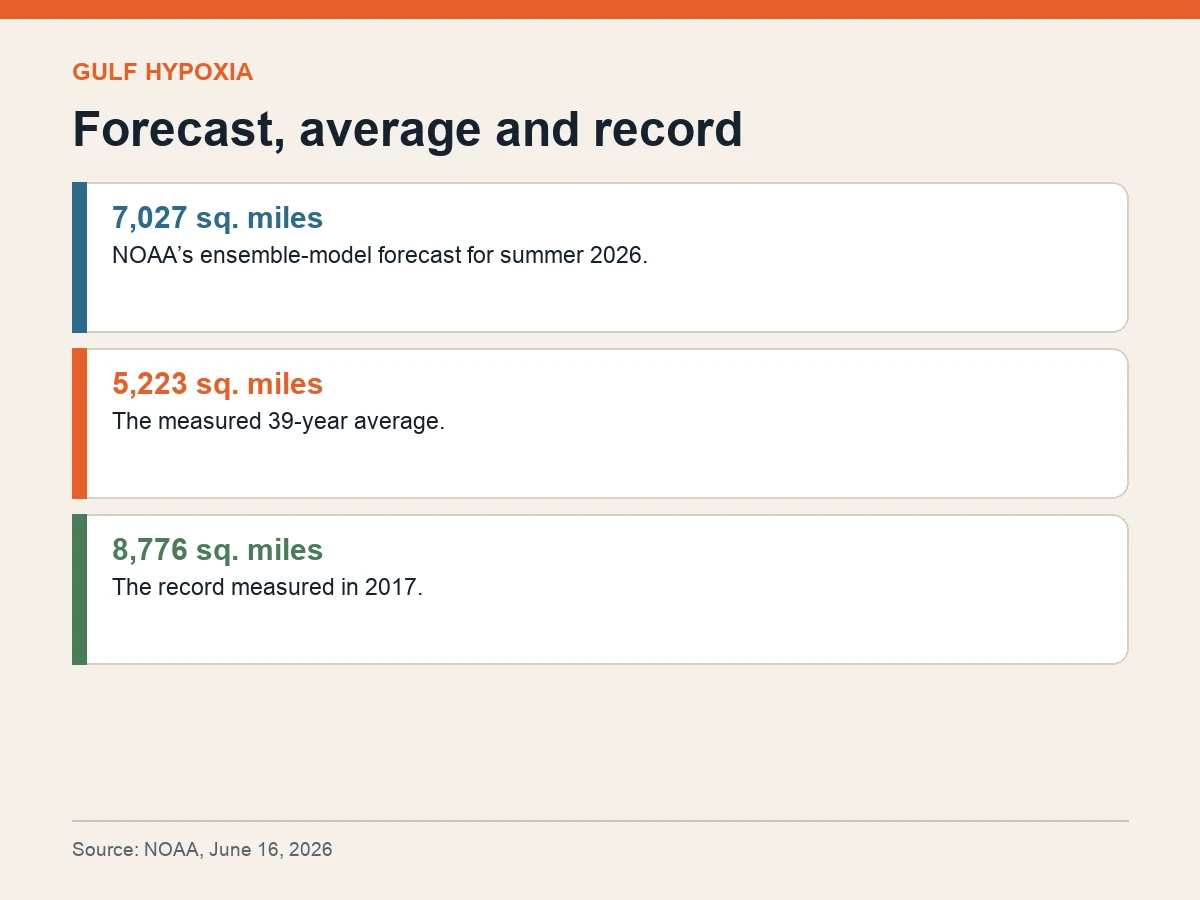
NOAA forecasts that the Gulf’s low-oxygen “dead zone” will cover about 7,027 square miles this summer, an area above the long-term measured average but below the record set nine years ago.
The estimate is roughly 1,804 square miles larger than the 39-year average of 5,223. It remains below the 8,776-square-mile record measured in 2017.
A dead zone forms when dissolved oxygen near the seafloor becomes too low to support much marine life. Nutrients carried through the Mississippi–Atchafalaya watershed stimulate algal growth; when the algae die and decompose, the process consumes oxygen.
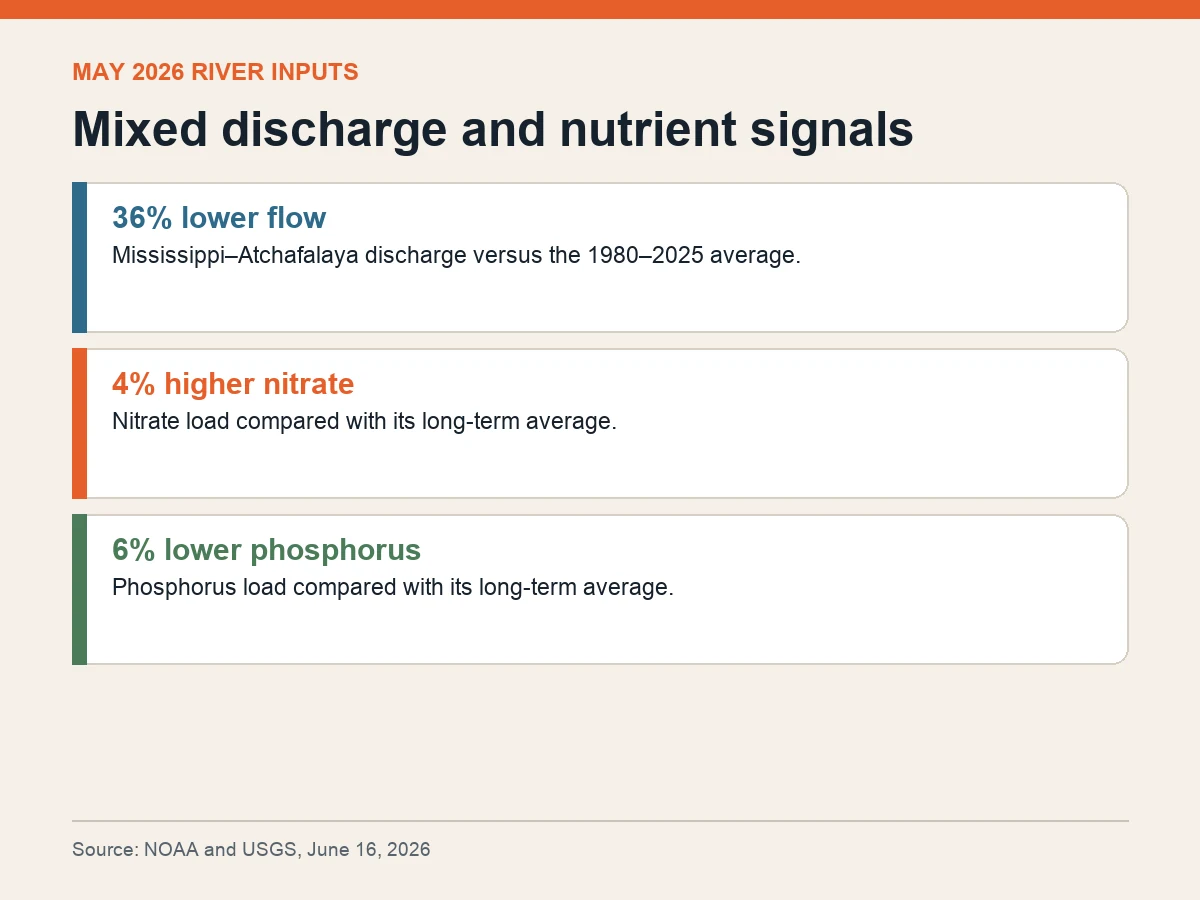
The 2026 inputs do not all point in the same direction. Combined Mississippi and Atchafalaya discharge in May was about 36% below the 1980–2025 average, while nitrate load was 4% above average and phosphorus load 6% below.
Those numbers show why river volume alone does not determine the outcome. Nutrient concentration, delivery timing, winds, currents, temperature and water-column mixing can all affect how much low-oxygen water develops and persists.
USGS supplies the river measurements used by NOAA’s forecast models. The monitoring network includes about 2,972 real-time streamgages, 92 real-time nitrate sensors and 37 long-term sites across the watershed.
NOAA combines several models into an ensemble forecast. This is the ninth year it has produced the estimate that way, using different model structures to reduce dependence on any single projection.
The forecast is not the final area. A NOAA-supported summer cruise will measure the hypoxic zone directly, with results expected in early August. Weather and ocean conditions between the river-loading period and the survey can move the observed number above or below the model estimate.
The interagency task force’s long-term goal is 1,900 square miles by 2035. Against that benchmark, even an accurate 7,027-square-mile forecast would leave the system far from the target and keep nutrient reduction—not forecasting precision alone—at the center of the policy challenge.