
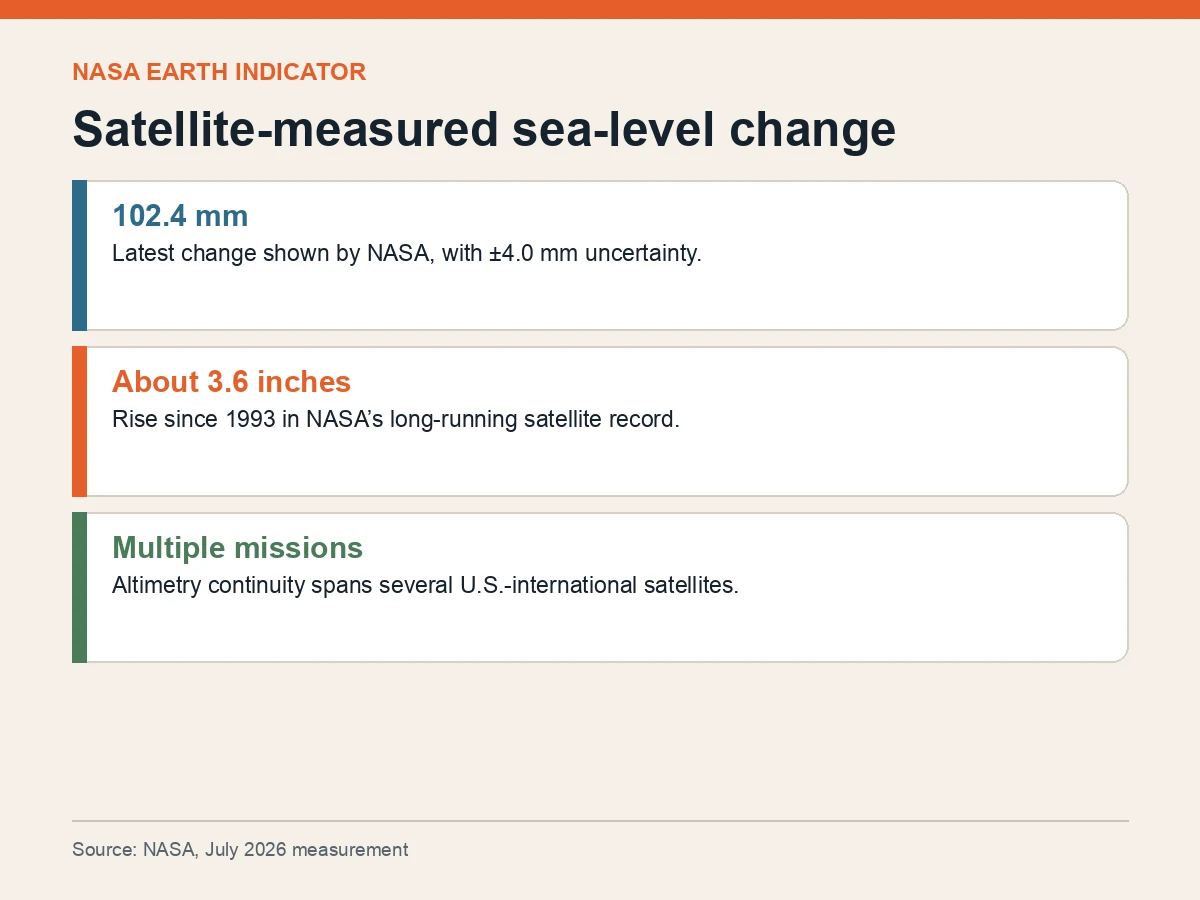
NASA’s latest Earth indicator puts global mean sea-level change at 102.4 millimeters above its 1993 reference, with stated uncertainty of plus or minus 4.0 millimeters.
The agency describes the long-term rise as about 3.6 inches since satellite measurements began in 1993. The metric integrates observations from multiple altimetry missions rather than a single coastal gauge.
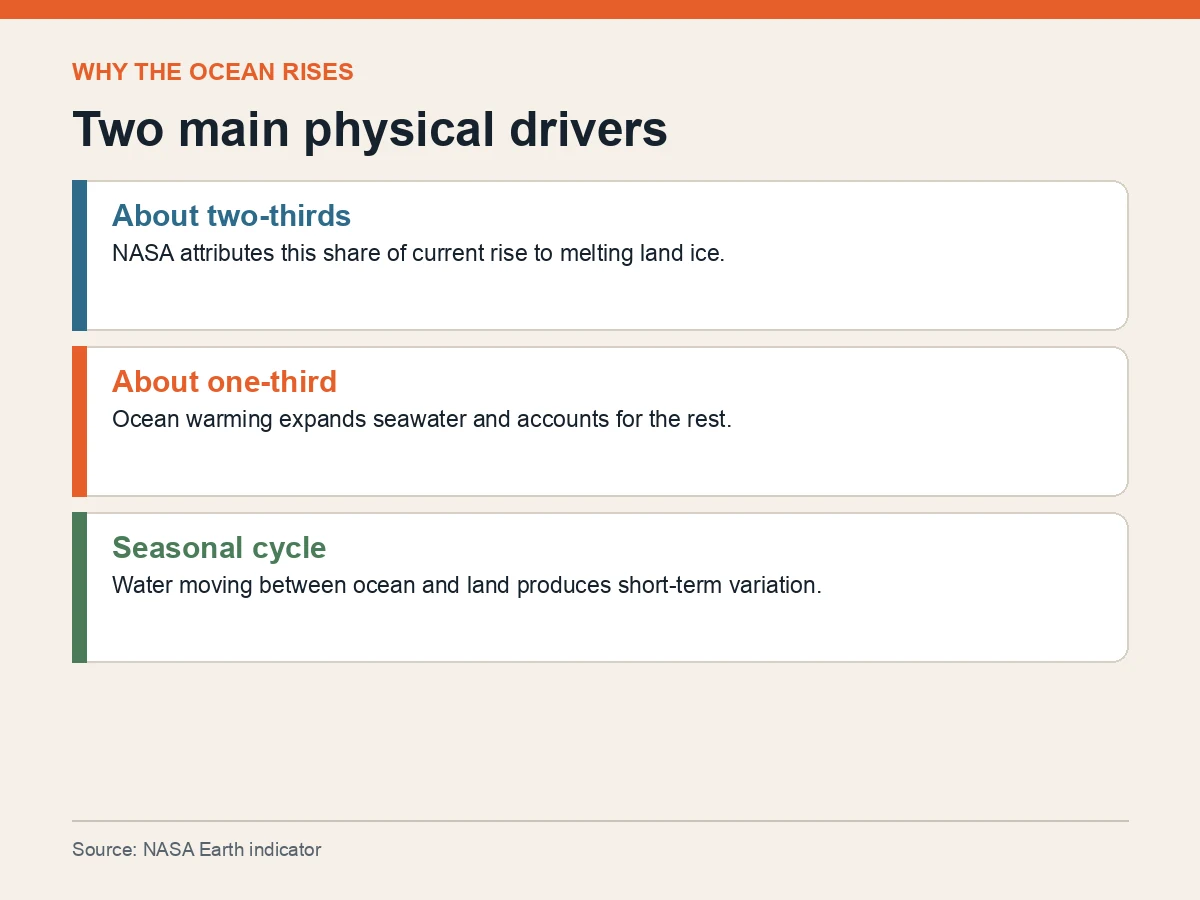
NASA attributes about two-thirds of current global rise to melting land ice and roughly one-third to thermal expansion as ocean water warms. Both mechanisms add height, but only melting glaciers and ice sheets add new water to the ocean.
The record includes seasonal movement. Water cycles between ocean and land through rain and snow, creating short-term rises and falls around the underlying trend. A single point should therefore be read in the context of the full series.
Mission continuity is crucial. Jason-3, Sentinel-6 Michael Freilich and other U.S.-international missions extend a measurement record built across changing spacecraft and instruments.
Global mean sea level is not a local flood forecast. Relative sea level at a particular coast can differ because land is rising or sinking, currents redistribute water, and storms, tides and atmospheric pressure create temporary extremes.
The ±4.0-millimeter range is also part of the result, not an optional footnote. It reflects limits in combining observations into a global estimate and means the displayed decimal should not be treated as perfectly exact.
For coastal planning, the global indicator supplies a common baseline. Engineers and communities still need local elevation, subsidence, tide and storm-surge data to design defenses or decide where adaptation is most urgent.
The signal is nonetheless unambiguous at the scale NASA reports: satellites have measured a multidecade rise. The accountability question now is whether infrastructure and land-use decisions use both that global trend and the local conditions that determine actual risk.
NASA publishes the indicator and mission context openly, allowing future updates to be compared with the same documented measurement series.