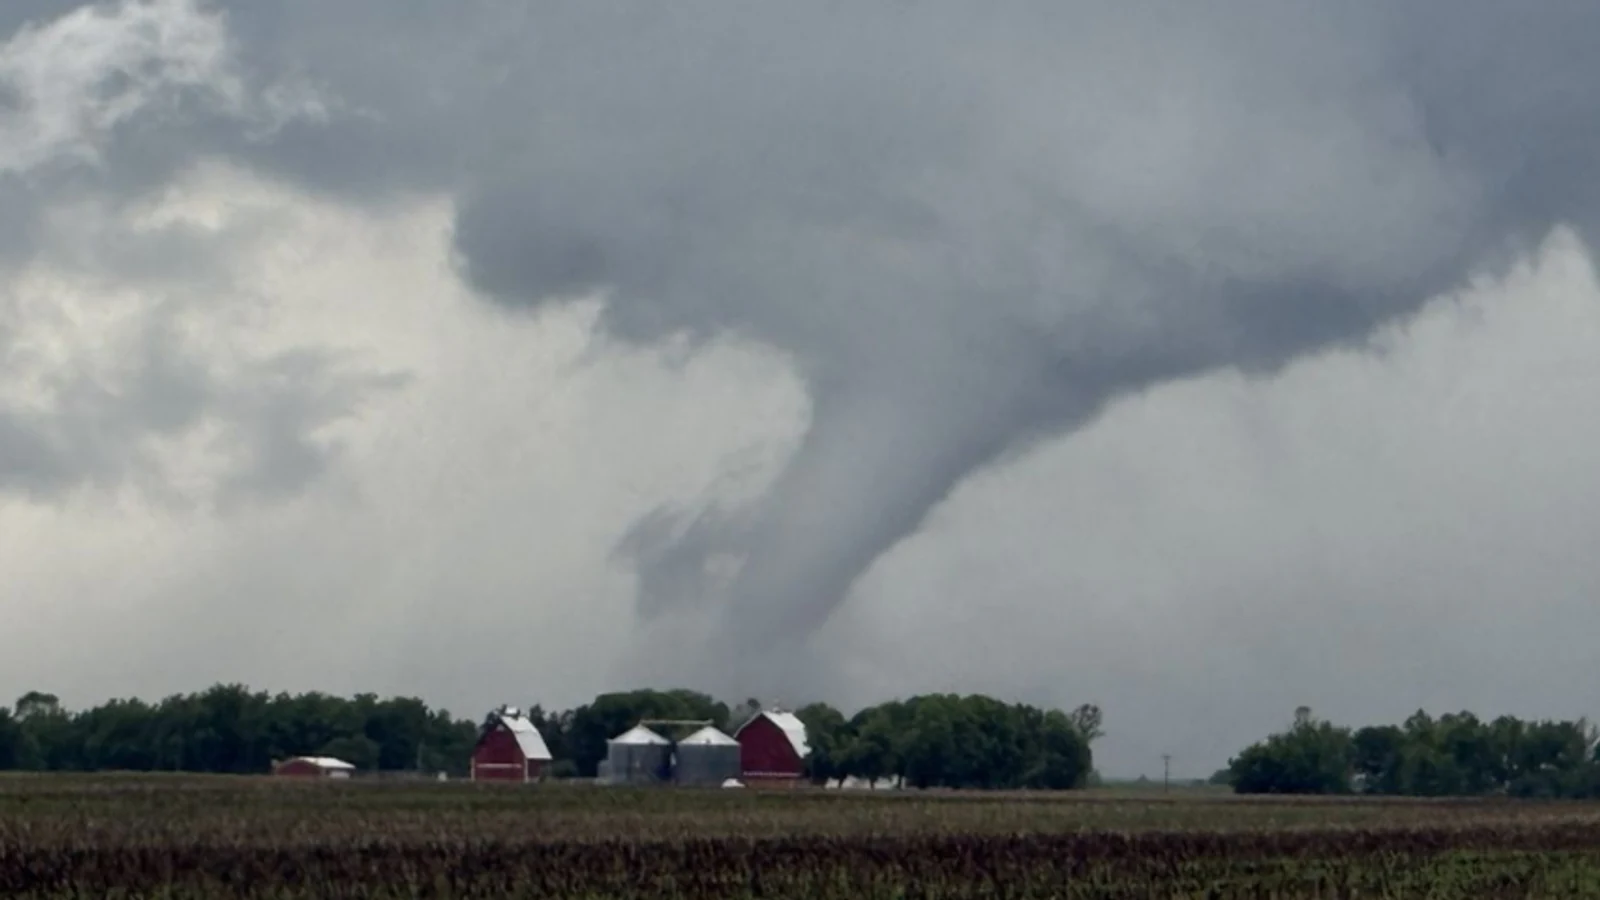
June brought 374 preliminary tornado reports across the United States while drought still covered 47.8% of the contiguous country at month’s end, a split-screen climate picture of intense Midwest storms and persistent dryness across much of the interior West.
NOAA’s National Centers for Environmental Information said Illinois recorded 91 preliminary tornado reports, Indiana 69 and Missouri 32. Each total set a new June record for that state, according to the agency’s July 9 national climate assessment.
The word “preliminary” matters. Storm reports are reviewed and can be consolidated or reclassified, so 374 is not the final confirmed tornado count for June.
A wet national average did not end Western drought
The contiguous United States received 3.23 inches of precipitation in June, 0.31 inch above the 20th-century average. That ranked in the wettest third of the 132-year record.
Yet the national mean masks sharp regional differences. The West and Southwest remained below 70% of their average year-to-date precipitation, even as rain eased drought across parts of the Plains, Midwest, lower Mississippi and Ohio valleys, Southeast and far Northeast.
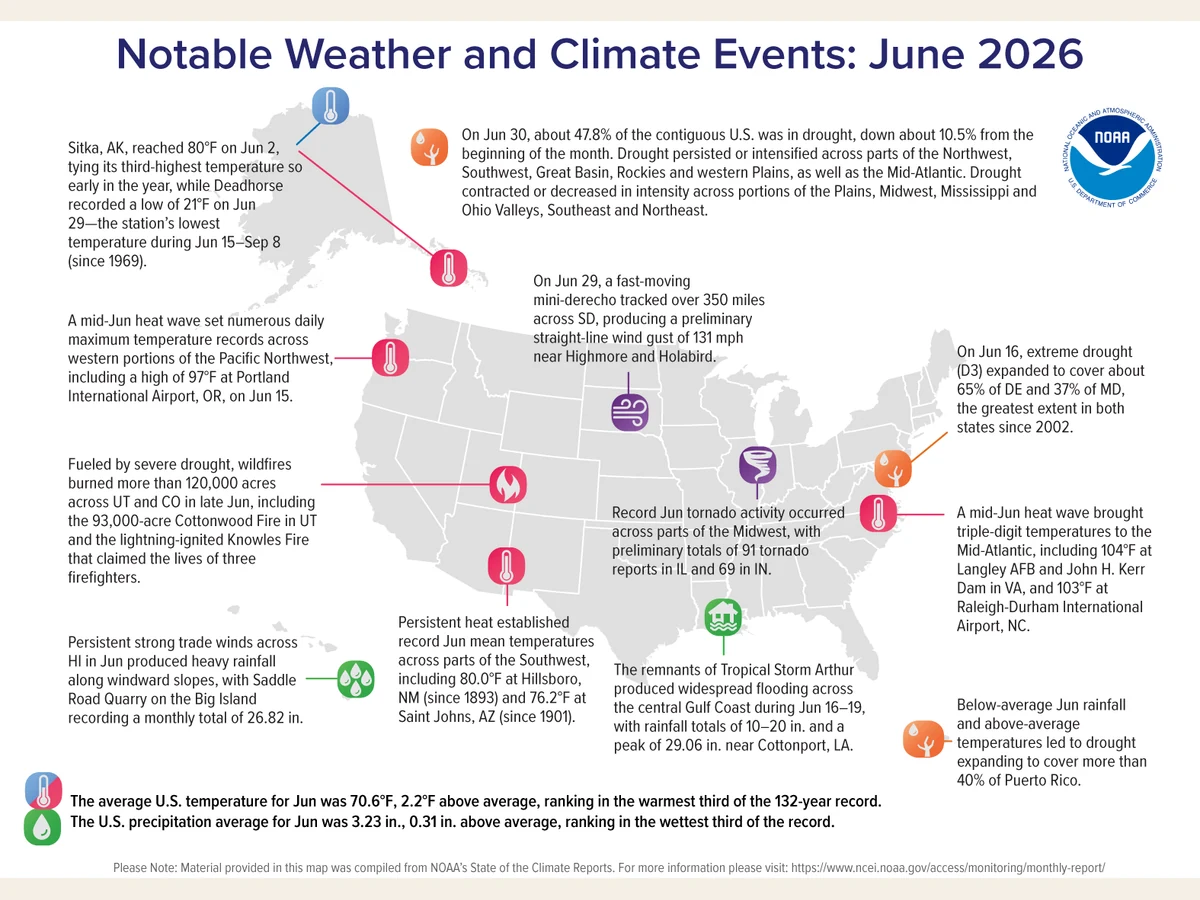

The June 30 U.S. Drought Monitor placed about 47.8% of the contiguous country in drought. NOAA described that as a decrease of about 10.5% since the start of June, but drought persisted or intensified across much of the Northwest, Southwest, Great Basin and Rockies.
The national temperature ranked warm, not record warm
The contiguous U.S. average temperature was 70.6 degrees Fahrenheit, 2.2 degrees above the 20th-century average. That put June in the warmest third of the historical record rather than at the top of it.
Above- to much-above-average temperatures covered much of the West, Southwest, southern Plains, Florida, Mid-Atlantic and Northeast. Parts of the northern Rockies and Plains ran below average, while portions of the Midwest and Southeast were closer to average.
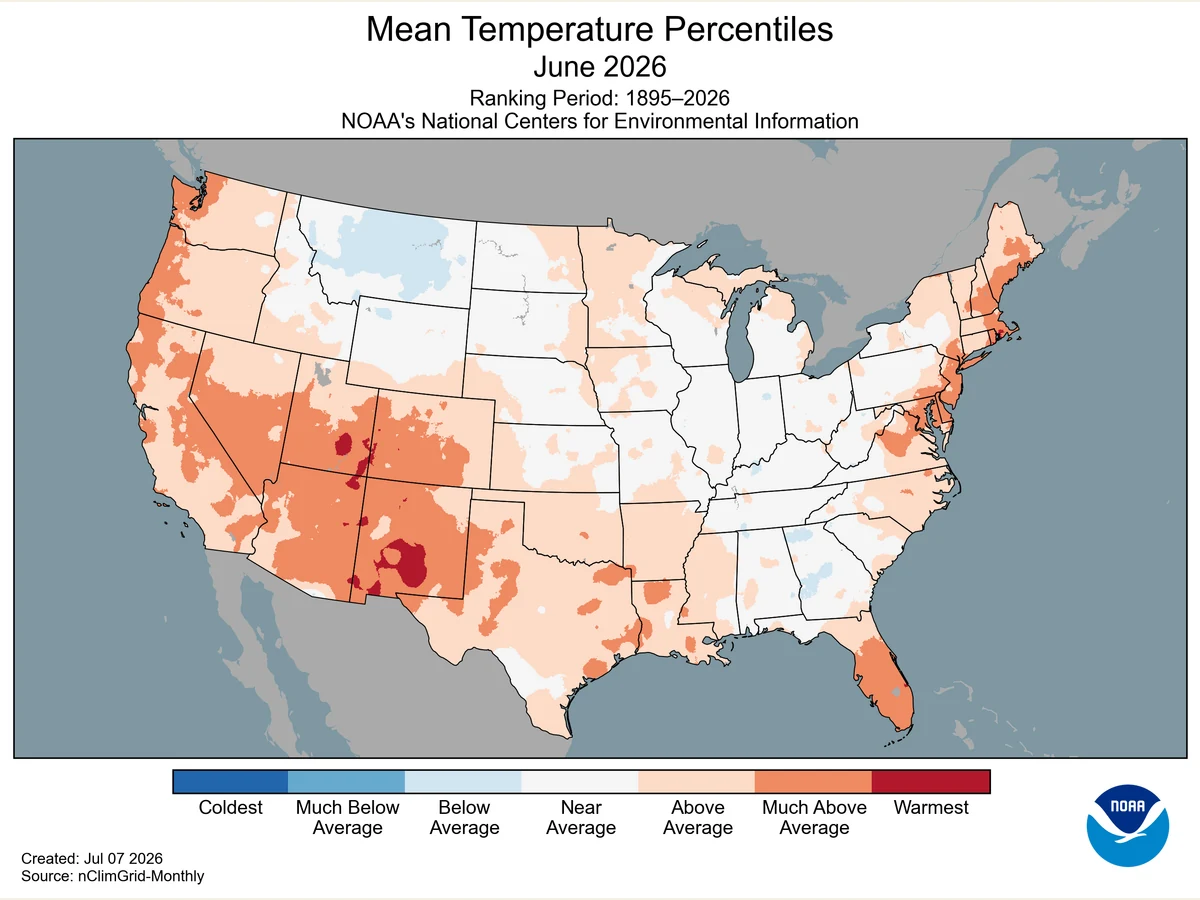

Across the first half of 2026, the West and Southwest climate regions posted their warmest January-through-June periods on record. That longer interval is a separate result from the national June ranking and should not be collapsed into a claim that every region had its warmest June.
Hawaiʻi supplied the other precipitation record
Hawaiʻi averaged 7.03 inches of precipitation in June, nearly twice its 1991–2020 average of 3.60 inches and the state’s second-wettest June in the record used by NOAA.
Its January-through-June total reached 54.62 inches, 24.87 inches above average and the highest first-half total in the state record, which begins in 1991.
How to read the month
The June assessment does not describe one uniform national condition. A wetter-than-average contiguous U.S. total can coexist with record-warm and dry conditions in the West because regional deficits and surpluses are combined into one number.
The same caution applies to the tornado total. A high concentration in three Midwest states drove the month’s severe-weather headline, while drought and heat remained the more important signals across large western areas.
NOAA’s monthly assessment is a snapshot based on the data available when published. Final tornado counts, later climate-quality control and subsequent drought maps can refine individual values without changing the core June contrast.