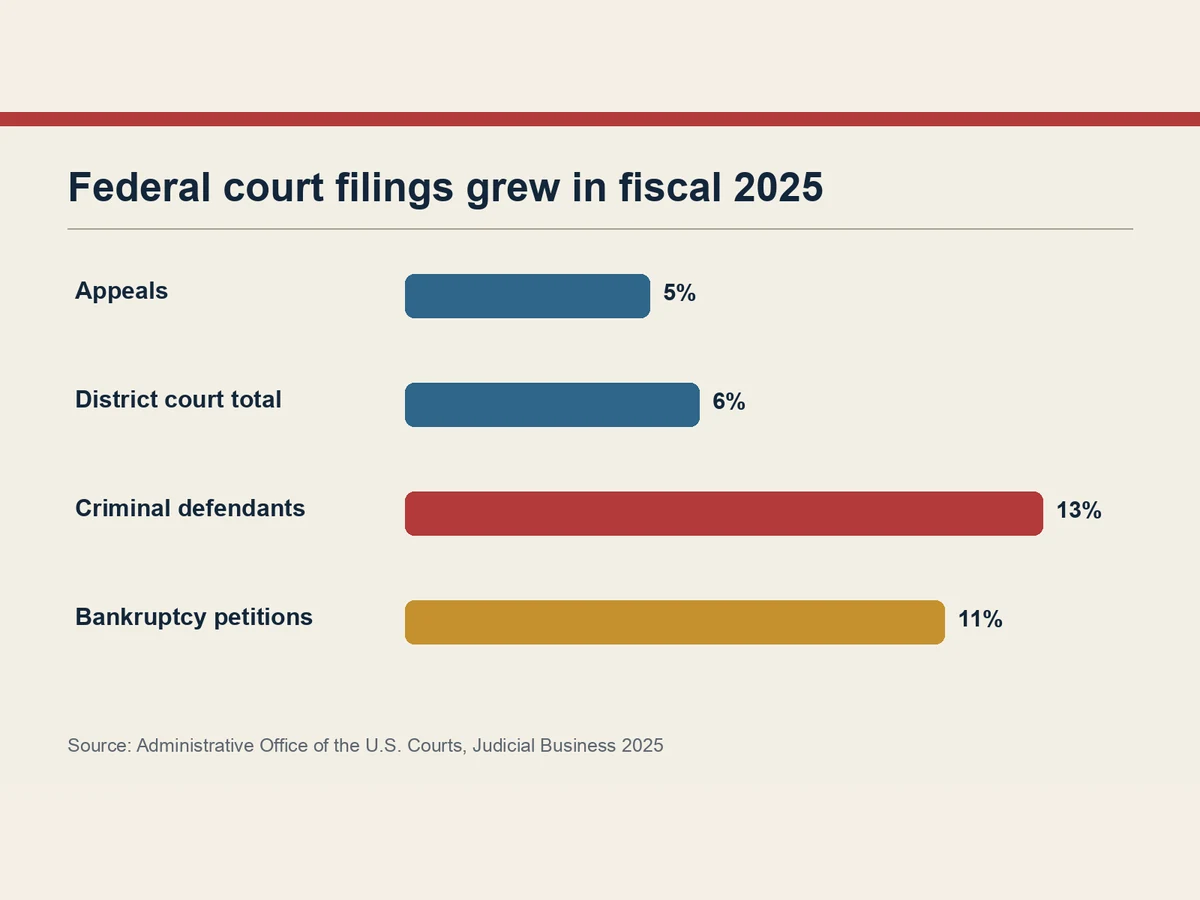
Federal court workloads rose across several major systems in fiscal 2025, led by a 13% increase in criminal-defendant filings and an 11% increase in bankruptcy petitions, according to the Judiciary’s annual statistical report.
The numbers use different units. A criminal filing counts a defendant, bankruptcy data count petitions and appellate data count cases. They should be compared within their programs, not added into one nationwide caseload total.
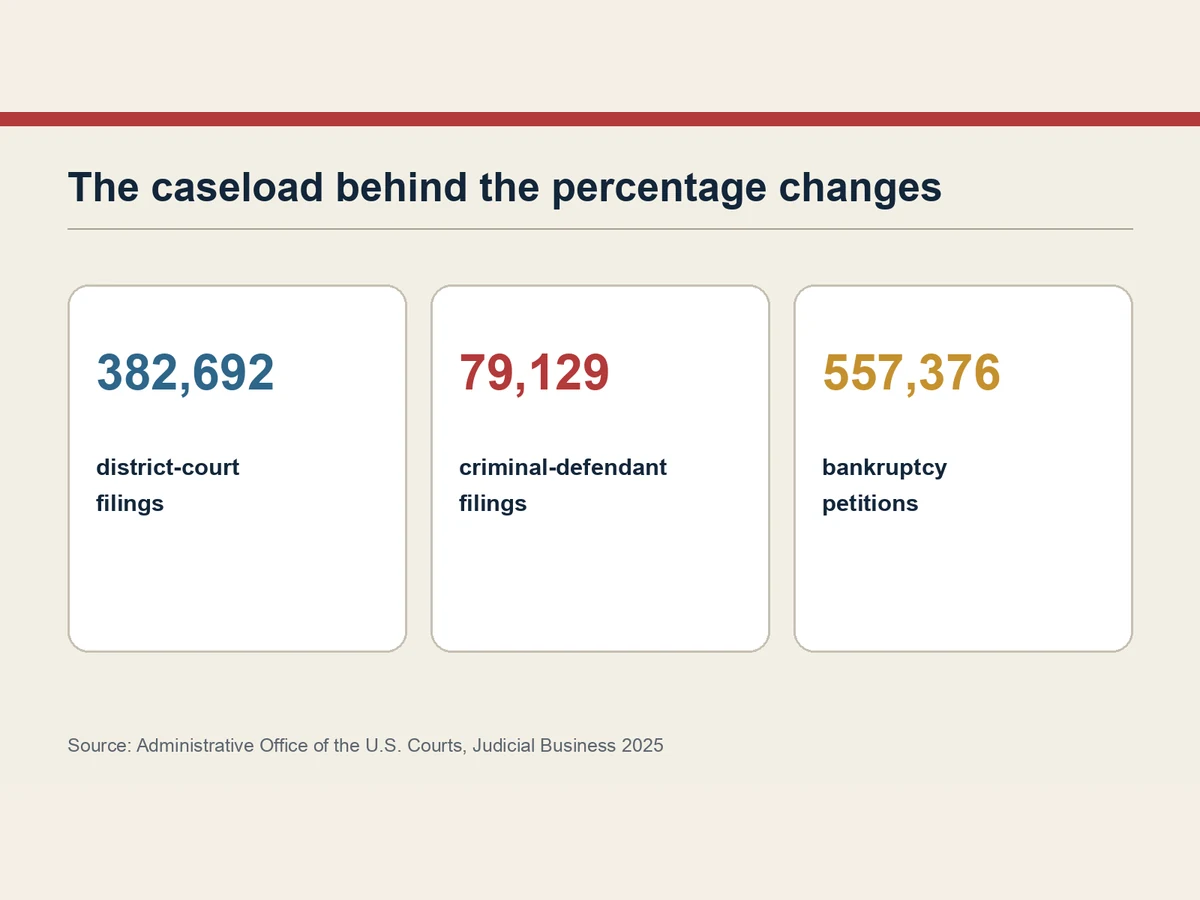
Combined civil cases and criminal defendants filed in U.S. district courts increased 6% to 382,692. Civil cases rose 4% to 303,563, while criminal-defendant filings reached 79,129.
Immigration-offense defendant filings rose 27% to 32,393. Southwestern border districts received 82% of those defendants and recorded a combined 17% increase. A filing is an accusation entering court, not a conviction.
Drug-offense defendant filings moved in the opposite direction, falling 6% to 15,651. Fraud-defendant filings increased 5% to 5,553.
Bankruptcy courts received 557,376 petitions, up 11%, and 83 of 90 courts recorded increases. Nonbusiness petitions climbed 11% to 533,337; business petitions increased 6% to 24,039.
Regional court of appeals filings grew 5% to 41,824. Pro se litigants filed half of new appellate cases, and their filings rose 9% to 20,878.
Supervision data were mixed. People under post-conviction supervision declined 2% to 119,532, while pretrial-services cases activated increased 12% to 81,228, excluding diversion cases.
The annual report describes demand on judges, clerks, probation officers and pretrial staff. It does not explain every underlying cause, and the safest interpretation is institutional workload: more matters entered several federal court pipelines during the year.Because the report compares the 12 months ending September 30 with the prior fiscal year, the percentages are year-over-year changes rather than forecasts. Local patterns also vary: a national rise does not mean every district or bankruptcy court received more work.
The figures provide a baseline for staffing and budget decisions. They can show where volume changed, but they cannot by themselves measure delay, case complexity, courtroom capacity or the quality of judicial outcomes.