
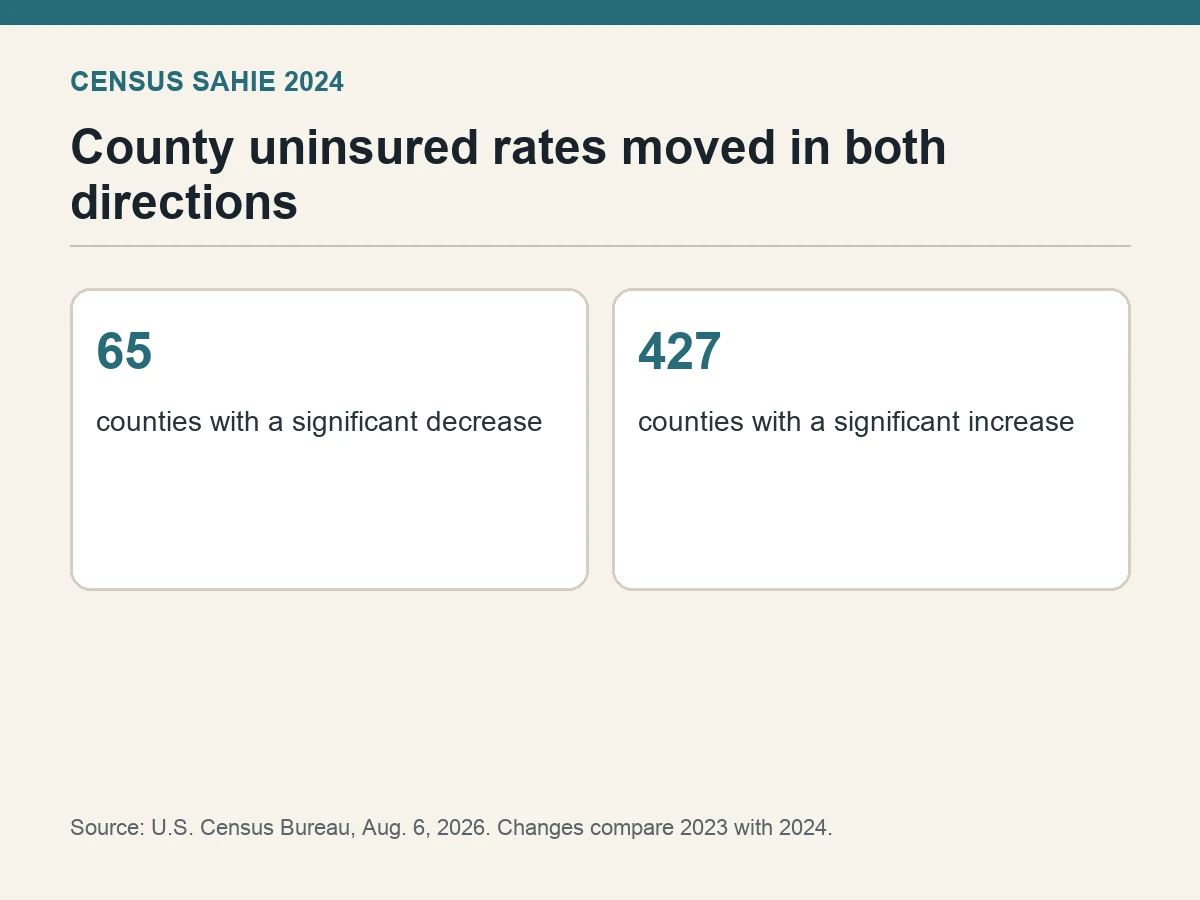
Health-insurance access deteriorated across far more counties than it improved from 2023 to 2024, according to newly released Census Bureau estimates for people under age 65. The bureau counted statistically significant increases in 427 counties and decreases in 65.
That is more than six counties with a rising uninsured rate for every county with a decline. The pattern does not mean every resident in those places lost coverage, but it reverses the direction readers might assume from the larger coverage gains seen earlier in the decade.
The Small Area Health Insurance Estimates program combines survey, administrative and demographic information to estimate coverage for counties and states. Because these are modeled estimates, Census tests whether a year-to-year movement is large enough relative to uncertainty before classifying it as an increase or decrease.
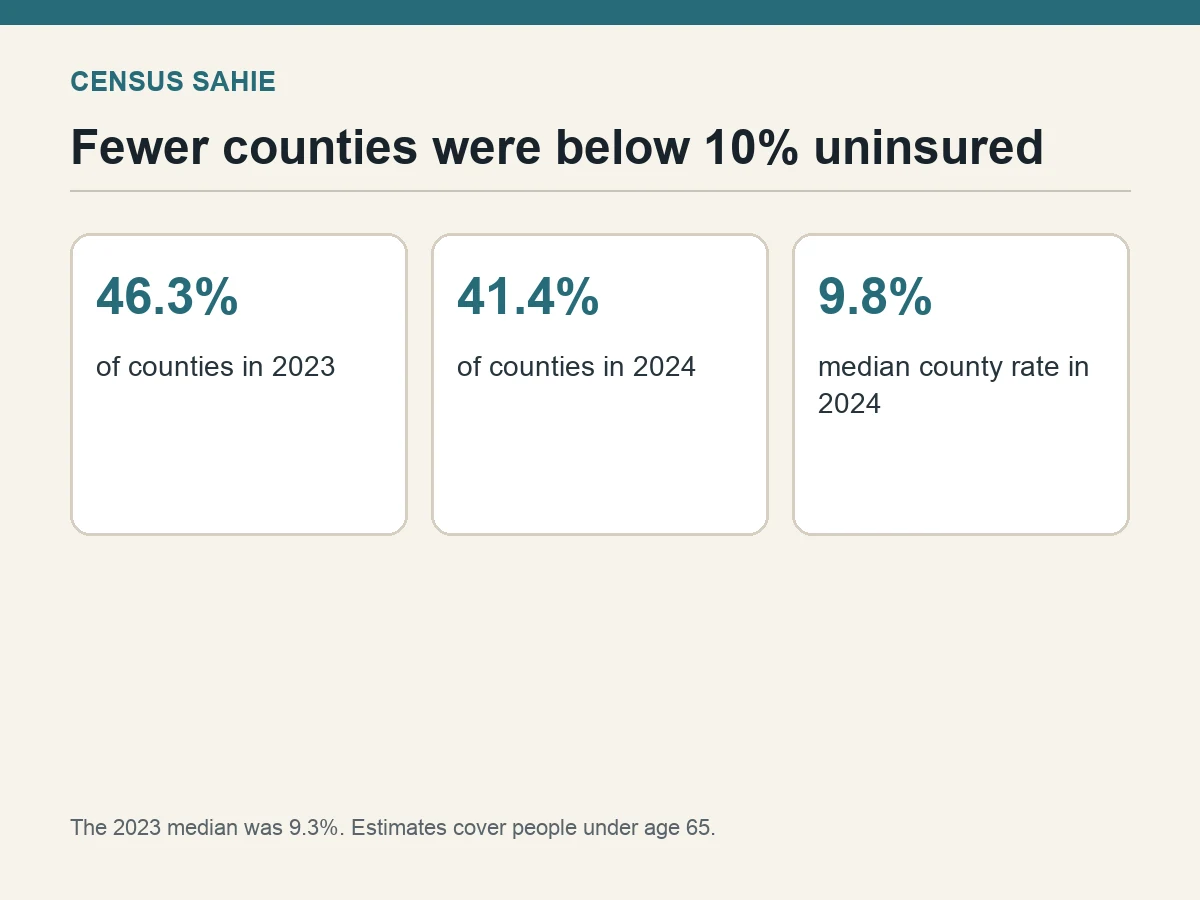
The national county distribution also shifted. In 2024, 1,300 counties—41.4% of the total—had an estimated uninsured rate below 10%. That share was 46.3% in 2023 and 45.2% in 2022.
The median county estimate rose to 9.8% in 2024 from 9.3% a year earlier. A median describes the middle county when estimates are ordered; it is not the national uninsured rate and it does not weight a large county more heavily than a small one.
Census reported the results for people younger than 65, the population most exposed to changes in employer coverage, Medicaid eligibility and the individual market. Most older adults are eligible for Medicare and are outside this estimate.
The release maps where rates changed, but it does not assign a cause to each county. Local job markets, income, age structure, state eligibility rules, renewal procedures and marketplace enrollment can all influence coverage.
For policymakers, the practical warning is geographic. A stable national average can conceal a growing number of counties moving above the levels they had reached a year earlier, and county estimates can identify where outreach or program review deserves closer attention.
The next useful comparison will require both the 2025 estimates and careful attention to their uncertainty. Until then, the 2024 map says the direction of change was broadly unfavorable even though many counties still maintained relatively low uninsured rates.